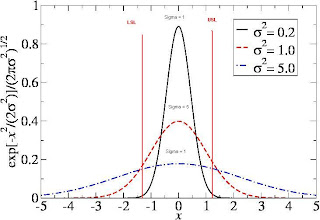
 This image shows curves having same mean, but different standard deviations. Mean is the line where most of the values will be crowded. The curve with the highest peak is running the most efficient processes.
 As the incline of the curve increases, the area that falls outside the specification limit is less. This means the number of defects is lesser as the peak gets taller. In the curve with the highest peak, less issues need to be addressed compared to the peak with least height.
Higher the value preceding the simga sign, the lower is the possibility of occurrence of defects. Thus, 8Sigma process has lower possibility than 6Sigma, which in turn has lower possibility of defects than a 4Sigma process.

No comments:
Post a Comment