
Tuesday, June 30, 2020
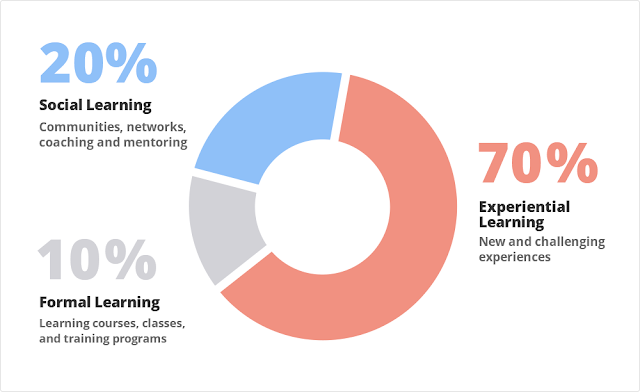
70-20-10 Learning Model
https://trainingindustry.com/wiki/content-development/the-702010-model-for-learning-and-development/
Friday, June 26, 2020
Ideation Workshop - Remote
- Introduction to collaboration tool (MIRO, MURAL, etc.)
- Background of the research - UX, Process, Data.
- Problem areas
- One problem for each session / multiple problems based on the number of problem areas identified
- Come up with 8 Ideas
- Look around and see other ideas, choose the best ones
- Talk about the best ones
- Choose 2 best
- Come up with Idea pad:
- Name of idea
- description of idea
- How might it work? step 1 ==> step 2 ==> step 3 ==> setp 4
- Target market
- Problem it is addressing
- Business benefit
- Customer benefit
- Market differentiator
- Buddy check --- review and comment buddy's idea(s) -- whats working good, what needs improvement and what are the opportunities
- Discuss
- Do a DVF on all the top 2 ideas.
- Come up with 2/3 best ideas.
- Story board the ideas.
Thursday, June 25, 2020

Wednesday, June 24, 2020
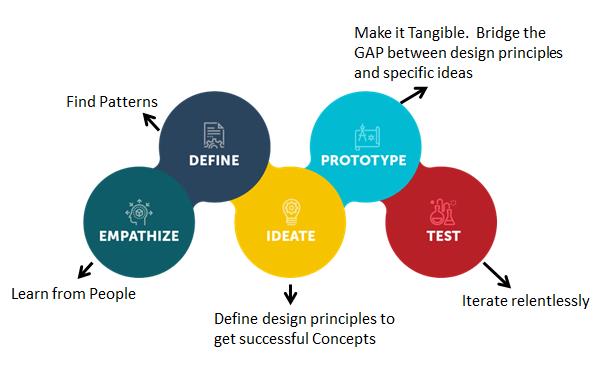
Some design thinking diagrams that resonate with me

- Empathise:
- Research
- Create research plan
- Recruit and schedule interviews
- Customer interviews
- Frontline staff interviews
- Team lead interviews
- Existing research Research
- Competitor research
- Analysis and synthesis of research
- Understand impact and rootcause of problems.
- Identify opportunities
- Define:
- Immerse into probelm area
- Playback the research
- Impact analysis of problem areas
- Collect data to assess severity, scale and frequency
- Analyse the data
- Workshop with SMEs if required to understand severity, scale and frequency
- Prioritise problem areas
- Problem prioritisation workshop
- Re-frame problem? is there a need? If yes, workshop
- Understand 5 Why's
- Create problem statements
Tuesday, June 23, 2020
Data-driven Design - Adobe
Data-Informed vs. Data-Driven approach to design
======================================
Data-driven: use this approach when you want to grow or optimize specific areas for e.g. signup percentages, views, clicks, etc. Data-driven is useful when there is a lot of traffic or users to collect the data.
Data-informed: use this approach when you are making design decisions that evaluate high-level user motivations, expectations, perceptions, or emotions. This helps in contexts where you are focusing on strategic decisions. For e.g. long term customer retention rates.
Quantitative vs. Qualitative
===================
- Quantitative data tells WHAT is happening or NOT happening. It's usually numeric data.
- Qualitative data tells WHY something is happening. Are not numeric.
Example - Google Analytics.
Quantitative data -- tells how many visitors come to your website, what they click, what they abandon. Doesn't tell why they may leave midway, or take a specific action on your website.
Qualitative data -- Why is one piece of content on your website more interesting compared to another is the insight we can get only when we do qualitative analysis.
Note: We should never trust one type of data to understand your product's usage patterns. Both Quantitative and Qualitative go together. Quantitative data tells you the current status, while qualitative gives you perspective.
Example:
- To understand how your product is performing, you can look at the usage data (quantitative) -- how certain features are being used / not used.
- However quantitative data doesn't tell why some users use or don't use certain features. For that, you will need to do qualitative analysis.
DATA HELPS IN FORMULATING A HYPOTHESIS ABOUT A PROBLEM AND HOW TO SOLVE IT!

Slow thinking manifesto

People tend to “think fast”*. This can lead to undesirable effects. The items on the left side facilitate “slow thinking”. They improve the quality of the right side and should therefore be applied consciously and intensively.
Apply the items on the left side one time more than your intuition tells you to!

Pic Courtesy: Mohd. Umar Farooq on LinkedIn
Friday, June 19, 2020

Data-driven Design

Data-driven design is design that is backed up by data. and helps users to understand their customers / target audience.
"It proves that you are on right track, reveals users' pain points, and opportunities while unearthing new trends and improves design by objectivity".
Thursday, June 18, 2020
Innovation vs. Iteration


Photo courtesy: Udemy
Objective: How to get higher
Iterate: get higher in the same direction, but doesn't tell you whether there is peak on the other side that can get you even higher than the current path would lead you to.
Rationality in the context of Critical Thinking
Rationality --- means we can reason with logic instead of actually going and checking. We can argue and debate about it in the boardroom without having to go and check to see what actually is correct.
Logic is a kind of bias. it's a shortcut to save time and is ultimately less accurate.
Mid 20th centry. We loved rationality. Just think of a logical argument and bingo that's what is correct. Led to ugly, unfunctional, premodernist tower blocks in Russia. (bare concrete, minimalist, visible structural elements) --- We built them because there was a logical argument for them.
What's rational is not always correct, and what's correct is not always rational.
19060s, 70s -- we shouldn't just do it because you can rationalise it.
The most rational logic system in the world wee have ever created is communism. Logically thought the best way to run governments. 70s we started realising what's been going on in the USSR behind cameras. We realised Extent to which governments could go to in the name of rationalism. Far worse than anybody who has done anything in the name of religion.
Antonio Damasio --- neuroscientist. Brain damage research cound't feel emotions. People with impared emotions cannot make decisions. Ccouldnt make the most basic of decisions -- side salad or chips with your food.
Brain damage -- we can't decide what to have with food.
What this means is we cannot make decisions without emotions.
We are slaves of emotions. They are the driving force that get us to do everything. Emotions are irrational, they are hard to talk about.
Trying to look rational and logical in a design meeting is a big issue.
Post rationalisation -- logically explaining why something that has been done has been done. Thinking something afterwards.
Talk to customers -- they will post rationalise why something has been done. Waste of time.
If we stop trusing what people say and instead start watching what they might do -- go to their house or workplace to see how exactly they are working, we may get better results.
When we talk theory, we see people guessing and post rationalize.
People are incapable of doing something, if they can't feel emotions to it.
Dont trust what people say, instead start trusing what they do. Cooperatively work with them to understand their pain.
> When people justify their actions or choices with purely logical reason, it's a lie.
> All decisions or actions have some emotional rationale behind them.
> We can't make choices without emotions.
People fear that they are irrational forces them to post rationalise and try and guess why things have happened or why they have taken a certain decision.
This is true of yourself, your coworkers.
Critical Thinking
============
1. Accept we are not logical thinkers, we are not rational thinkers. And the fact that there is no such thing as rational thinker (in the context of humans and their emotions).
2. Can't decouple emotions from choices.
There's an emotion behind everything. When people post something -- on a blog or on social media, they "hope" to get more followings, likes, better jobs....
- Nobody is 100% correct or wrong
- Explore and try out other points of view
- Gather all information (across a broad, whole range of medium)
- What motivations and assumptions are present in the problem you are trying to solve
- Keep a single source of truth
Critical thinking is a good antidote to rational logic.
We always need to challenge our assumptions. We should always assume we are wrong. We should always document the problems we are trying to solve and for who.
Data-Driven Design
==============
Innovating or Iterating?
Both are different ways of working.
Tuesday, June 16, 2020
IDEO Founder David Kelly on Design Thinking
The key tenet of Design thinking is “empathy for the people you’re trying to design for.”
Monday, June 15, 2020
Lean Brownbag
- Lean is a philosophy or methodology
- Isn't something you do
- You "think" in a lean way.
- You use tools to embody
Lean Definition
Lean is a (1) systemic (2) pursuit of perfection with (3) relentless identification and (4) elimination of waste and (5) non-value added work.
There are five aspects of it as seen in the above statement.
- Systemic
- Pursuit of perfection
- Relentless Identification
- Elimination of waste
- Non-value-added work
- Sakichi Toyoda -- Toyota Motor Corporation
Flow
Achieve smooth flow as in a river
Rocks, leaves/ branches inhibit the flow
When the flow is smooth --- waste is minimal, and velocity is high VICE VERSA.
Three kinds of work
- Value-added (VA). All three must be met for a task to be value-added.
- This is something the customer is willing to pay $
- It is right the first time. Rework is a waste
- Transformational meaning changes form (physical characteristics of the product like shape, weight, colour, etc.) / fit (fits intended application) / function (Function of what the product actually does) -- the task must change the form fit or function of the product for it to be considered value-added. An exception though is an inspection at the assembly line - it is required so we don't let out a bad product.
- Value enabling work (VE)
- Is something that has potential for elimination in future but not immediately.
- Some but not all of change to form / fit or function.
- Example banks doing a credit check - would you be willing to pay for it. I won't be. But it also depends on who the customer is. An individual wouldn't pay, however if the customer is a bank, it would be willing to pay.
- VE is usually related to regulatory / compliance (SIRA for long tail claims).
- Non-value added work (NVA)
- This is waste
- Lean INCREASES value Add
- Understand and DECREASES Value Enabling
- Gets rid of NVA

8 Kinds of Wastes
- Waiting - no changes to form, fit or function.
- Rework - not done fight first time
- Transportation - Movement of work between work stations.
- Movement - How do you work? work moves between me, manager, to someone else, back to me, goes in loops. All this is waste.
- Overproduction - too much of production
- Over-processing - do something even before it is needed.
- Inventory - excessive inventory, order only what you need
- Not utilizing staff to full potential - using a highly skilled person to do silly jobs.
Gemba

Value stream

Friday, June 12, 2020

Ideation Workshop
IDEATION WORKSHOP
=================
=================
1. Background
2. Research snapshot
3. Key insights / opportunity statement / HMWs
4. Overview of key insights
5. Data story / overview
6. Key Insights in detail
- Insight statement
- Snapshot of the problem
- Insights into our processes & capability around the problem area
- What we have heard from customers (Medallia)
7. Reflections -- discuss on what has been presented
8. IDEA GENERATION
==================
-- Re-focus on your problem
- familiarise with problem you are solving
-- Generate as many ideas as you can - 8 ideas, 5 mins, quantity not quality, write or draw
- 8 ideas
- 5 minutes
- Quantity not quality
- Write or draw
--- Share ideas on your table - 1 min each, no feedback, listen and get inspired
- 1 min each
- No feedback
- Listen and get inspired
--- Document 2 best ideas
- 10 mins each
- 2 ideas
- Picture description, title
- Take inspiration from others
--- Share 2 best ideas and get feedback
- 1 min pitch
- 2 mins feedback
- Write down your feedback
- Listen don't defend
--- Incorporate feedback
- 10 mins
- Evolve your idea based on feedback
--- Prioritise ideas
- Group similar ideas, but keep them distinct! Don’t make them too big.
- Agree on groups
- Name each group
- Vote! One dot per person
- Which idea best addresses the problem we are solving for?
- Select top 3
--- Share 3 ideas and get feedback
- 10 mins share
- 10 mins feedback
- Write down feedback
- Listen don't defend
--- Choose best idea
- Review feedback
- Select top idea
- Which idea solves the prob you are trying to solve?
9. STORYBOARDING
================
--- Flesh out ideas
- 20 mins
- Write down the ‘steps’ in the experience
- Circle 6 key steps
- Draw each scene
of the experience
- Capture customer perspective:
think, feel, do
--- How do we bring this to life?
- 15 mins
- What do we need from customers, business, process/tech/data, our people?
--- What would stop us?
- 10 mins
- What are the key barriers and how do we overcome them?
10. DEFINE MVP
=============
--- Define your MVP
- What's the elevator pitch
- How does it work?
- What is the customer and business value?
- Must haves vs. nice to have's
- What does success look like?
- How will we support our people to deliver?
--- Pitch MVP to room
11. NEXT STEPS
==============
--- Review and iterate on ideas (the above ideas)
--- Prioritise and select top idea
--- Assess viability and feasibility
--- Test with customers (prototype and test with customers)
Wednesday, June 10, 2020


Subscribe to:
Posts (Atom)
SQL Essential Training - LinkedIn
Datum - piece of information Data is plural of datum. Data are piece of information - text, images or video. Database - collection of data. ...

-
 Definition ITIL is a " framework of best practice approaches intended to facilitate the delivery of high quality IT services" . It...
 -
High Maturity in CMMI for Development - Part 1 Reference: http://www.connect2hcb.com/tiki-index.php The high maturity concept in CMMI ...