Wednesday, February 21, 2007

CM Audits

There are two types of CM Audits:

  1. Physical Configuration Audit: To determine that the configuration item conforms to physical characteristics expected.
  2. Functional Configuration Audit: To verify that a Configuration Item’s actual performance agrees with its software requirements.

Configuration audits are performed differently for development and maintenance projects.

For development projects:

  • When software is being delivered / major release
  • End of each phase

For maintenance projects:

  • Periodically, considering that there are no major releases.

Monday, February 19, 2007

CMMI L2 and L3 - Critical Differences

Level 2 organizations do not plan to manage project risks. Risks could possibly become issues as the project progresses. Therefore, it is important to identify the potential risks, prioritize them according to the impact they might have on the project, and revisit them at regular intervals. While this happens at Level3, it is missing at L2.


Wednesday, February 14, 2007

1. Define Phase

In the Define phase, we identify and get approval for six sigma projects. i.e. identify potential projects, shortlist them based on risk / effort / impact, and create a charter for the selected project.

So, the steps involved in the Define phase are:

1. Identify potential projects
2. Define the problem and objective
3. Shortlist projects based on risk, effort, impact
4. Create process overview maps (bird's eye view of the process)
5. Define project scope using SIPOC (Supplier, Input, Process, Output, and Customer)

When identifying projects for six sigma green belt, you should take into account not only the voice of business, but also voice of customer, cost of poor quality, and service quality gaps. This would lead to identification of factors critical to quality for your company. Against each project, list the related VOC, VOB, COPQ, and service quality gaps.

The ideal project will have the following characteristics:

a. Chronic problem (problem keeps recurring)
b. Huge impact on business (the problem should have direct benefits in terms of impact on the company's business)
c. Low risk (the project should carry low risk)
d. Less effort (you should be able to finish the project within a given timeframe)

The above combination is not realistic in the sense that it is difficult to find projects that have all these characteristics. A more realistic approach would be checking each project's Risk vs. Effort vs. Impact. Choose projects that have high impact, less effort and run low risk.

Tuesday, February 13, 2007

8 D Problem-solving Technique

  1. D0 - Prepare
  2. D1 - Establish the team
  3. D2 - Describe the problem
  4. D3 - Interim containtment action (to safeguard the customer, place a temporary solution)
  5. D4 - Define and verify root cause and escape point (a point where the problem could have been cought but was not)
  6. D5 - Permanent Corrective Action (PCA) : This solution would solve the problem of the team facing it, and not the entire org.
  7. D6 - Implement and validate the PCA : Check if the placed solution works.
  8. D7 - Prevent occurrence: prevent occurrence of the event for ever so that it can be prevented from occurring in all projects across the org.
  9. D8 - Recognize

5 Whys...

You will reach the root cause within 5 whys.

1. Why X has happened?
Because of some Y....
2. Why did Y occur?
Because of factor Y1
3. Why did Y1 occur?
Because of Y2
4. Why did Y2 occur?
Because of Y3
5. Why did Y3 occur
ANSWER

Past - Current - Futuristic

Most of the companies focus their energies in solving the following kinds of tasks:

1. Past related (rework, correction, pending)
2. Current (supposed to be done one mondays as usual)

They do not have time to focus on futuristic activities or plan for them in the first place. The ratio of (past + current) : (futuristic) for most companies is 70:30. This was the same for Motorola as well, while it was 30:70 for Toyota. So Motorola investigated the case further. It found that rework / correction...and current tasks are because of inefficient handling of issues, and issues kept appearing later though they were supposed to have been solved once. This was not the case with Toyota.

According to six sigma, resolve problems once and for all, so they would never recurr.

Mc Donalds...process control

Mc Donalds has transformed the art of cooking into science. In all its outlets worldwide, the variation in tastes of food it serves is almost identical. This has been achieved by carefully controlling the process that goes into preparation of the food.

ICICI - Addressing variation in customer needs...

At reservation counters / banks, which offer single window services, it is often seen that one line moves faster than the rest. (Lets not consider the capability or otherwise of the people who man the counters) Someone who comes late and is queued up in a line that moves faster, gets his work done faster than one who although has arrived earlier is held up in a slow moving line. This often leads to customer dissatisfaction.

ICICI has addressed this problem by introducing the token system - a solution that is foolproof and offers complete customer satisfaction.

DMAIC and DMADV

DMAIC - Define - Measure - Analyze - Improve - Control

DMAIC is a structured and repeated process improvement methodology, which focuses on defects reduction and helps improve existing products and processes. DMAIC is a defect reduction strategy.

DMADV - Define - Measure - Analyze - Design - Verify

Unlike DMAIC, DMADV is for develop / re-designing new products/processes. DMADV focusses on preventing errors and defects.

How smart customers quiz companies claiming 6sigma certification...

  1. Which processes of your company are at six sigma level?
  2. What are the specification limits of those processes? (Note that spec limits are set by the customer, while UCL and LCL are 3 times the standard deviation)
  3. Is your company willing to take penalty for defects?

Companies are NOT certified Six Sigma...their processes are...

Companies are not certified six sigma, their processes could be at six sigma level. Implementation, monitoring and control of six sigma are all done within the company implementing the six sigma program. No one outside comes and inspects it.

Companies focus on critical processes (as per VOC /VOB) and then take them to levels of six sigma efficiency.

Sunday, February 11, 2007

Mistake proofing...

Mistake proofing is when you take precautions to ensure that there is no possibility of error occurring. In England, it was found that people mistook between petrol and diesel fillers while fueling their cars at gas stations. (They have to fill it by themselves) . Manned gas stations did not solve the problem completely because there was always the possibility of human failure. Ultimately the car manufacturers fitted the petrol cars with positive polarity fuel tank mouth, and diesel cars with negative polarity. The gas stations had exactly the opposite polarity - petrol dispensers were fitted with negative polarity, and diesels dispensers with positive polarity. (Like charges repel, unlike attract!!!).

DPMO View

What is the need to view defects "per million", can % view not suffice?

Defects per million gives a better insight into defect severity. This magnifies defects and makes the performance look better (if the process is efficient). For example, you can talk that your process has only 1% defects. When talking in terms of percentage, the severity of defects does not seem much. Defects look manageable!!!

Parts per million magnifies the defects and shows a more realistic picture. When translated to PPM, 1% is equal to 10, 000 defects per million! Now this seems too big a value to neglect.

Instead of PPM, a better way to denote variation is by calling points as defects. Thus, we have DPMO (Defects per million opportunities) instead of PPM.

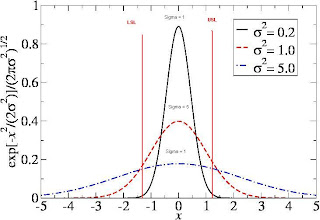
Same mean, diff std dev curves...

This image shows curves having same mean, but different standard deviations. Mean is the line where most of the values will be crowded. The curve with the highest peak is running the most efficient processes.

As the incline of the curve increases, the area that falls outside the specification limit is less. This means the number of defects is lesser as the peak gets taller. In the curve with the highest peak, less issues need to be addressed compared to the peak with least height.
Higher the value preceding the simga sign, the lower is the possibility of occurrence of defects. Thus, 8Sigma process has lower possibility than 6Sigma, which in turn has lower possibility of defects than a 4Sigma process.

Friday, February 09, 2007

Data Types

There are two data types: 1. Attribute 2. Continuous. Attribute data has countable quality characteristics for example, number of defects, Number of defectives, Number of NCs, etc. Continuous data on the other hand has measurable quality characteristics. For example, length of a spark plug, weight of a spark plug, temperature at which the spark plug has maximum efficiency, etc.

If a software project just collects data on whether each milestone is met or not met, it is collecting attribute data. This does not tell us whether we have overshot or under met the expectations.

Another example that shows the difference between attribute and continuous data: In a glass (drinking water glass) manufacturing industry, there are two teams, which assure that length of the glass is of stipulated length. The first team uses Vernier Calipers to measure the length. If the glass is of stipulated length, it passes the quality check, otherwise not. This type where the length of glass is MEASURED, is called Continuous data. The second team uses the go-noGO gauge technique. Here, the glass is allowed to pass through two separate raised platforms. The first platform has allows glass of stipulated length, while the second one allows only shorter. The inspection items are passes thru both the platforms one after another. If any glass passes thru both of them, then it is of shorter length than desired. If it does not pass thru any of the two platforms, it is of longer length. This way of gauging relies on ATTRIBUTE data, because the team checks for Yes/No condition for each glass.

Attribute data does not need costly implements. In our example, the second method is far cheaper than engaging vernier calipers, but we lose a lot of detail.

Note: Difference between defects, and defectives. “Defects” is the total number of defects in all the pieces inspected. “Defectives” is the count of items which have defects. For example, in a water glass manufacturing industry, in a lot of 100, these defects were found in one inspected item: the length of the glass is improper, has cracks. In another inspected item these defects were found: shape was malformed.

So, out of 100, the defectives here are 2 glasses, while the defects are three (for glass 1, length and cracks, and glass 2 the malformed shape). “Defects” therefore is always a better representative of the abnormalities / deviations, than “Defectives”.

Note that continuous data can be converted to attribute data, but vice versa. So, it is always better to go for continuous data if there is a possibility to measure it.

Quartile Deviations – Sample & Analysis

This table represents the marks scored in math exam by students in XII-A, XII-B, and XII-C sections. The Q4, Q3, Q2, Q1, and Q0 are the quartiles. In lay terms, the quartiles, divide the range of marks into 4 sections.


Q0-Q1 is the first quartile
Q1-Q2 is the second quartile
Q2-Q3 is the third quartile
Q3-Q4 is the fourth quartile


For XII-A, there is not much variation between Q3 and Q4. This means, there is little variation among the top performers of the class. Q3 and Q2 show some variation.

Mean, Media, and Mode

All these three are central tendencies. They are central score among a set of scores. Mean is heavily influenced by extreme values hence is not suitable for measuring process performance.

[Mean is also called average; median is the middle value in a set of sorted data; mode is the value repeating most of the times]

An illustration representing the fallibility of Mean and merit of Median is given below:

These are the marks obtained by students in mathematics in a particular class.

Marks
95
45
34
67
78
99
87
89
67
56
45
65
65
67
87
84
96

Here, the mean is 66.65, and the median is 67. If the mathematics teacher is asked to improve the MEAN MARKS BY 20 (i.e. performance should be so enhanced that mean becomes 80), it would be quite an easy task. Since mean can be boosted by inflating the extreme values, the teacher might pick up the brightest students of the class (students who have already scored quite high), and improve their performance. For example, a student at 87% can be easily trained to perform at 100%. (while neglecting the weak students, as training them and expecting a good performance so as to boos the overall mean is a pretty time consuming task…and that too without a promise of success).

If on the other hand the teacher had been asked to raise the median by 20, then it would not have been easy. For the median to increase, the performance of at least half of the class needs to be improved. Half of the class has to score more than the set target.

In Customer satisfaction index, for example, it is better to focus on median than on mean.

So, median is a better representation of a set of data compared to mean.

Formula for median in Excel =median(a2:a12)

Formula for quartiles:

Q1 = Quartile(a2:12, 1)
Q2 = Quartile(a2:12, 2)
Q3 = Quartile(a2:12, 3)

Standard deviation gives a measure of dispersion (the extent to which values vary from the mean). Therefore standard deviation is a good measure for process performance rather than mean, median or mode.

2. Measure

This is the second phase in the DMAIC phases of Six Sigma. A measurement system is created, which helps in knowing Ys and identifying potential Xs for the Six Sigma initiative. A measurement system is established to ensure that the data collected for the six sigma project is accurate.

In Define Phase – the phase prior to Measure, the potential projects (problems/opportunities (Ys)) are identified. Approximations of the size of the six sigma project are taken to draft a schedule. In the Measure phase, the actual indicators are identified and the quantum of work is identified. This gives the correct estimate of the volume of work on hand, which helps in accurate estimations.

The data collected for the six sigma green belt project should have the following characteristics:
  • Accurate (Observed value should be equal to the actual value), no matter how many times the task is performed.
  • Repeatable (When a person performs the task twice, he should be able to yield the same results)
  • Reproducible: (When two persons measure the same item, the results should be identical.). An example of reproducibility is software estimates. No matter who does it, the estimates should be in close proximity to one another (i.e. they should not vary much).
  • Stable: The results should be stable over a period of time.
The roadmap for "Measuring" is as shown in the diagram above.

Note: that the first three steps could have been done in the Define phase itself. In the define phase, an approximate of Y’s volume is taken, while in the Measure phase, the actual volume of Y is calculated. If in the Define phase, only the approximate idea of size of Y is known, then the first three steps are required in Measure phase, otherwise not. On the other hand if you know the size in the Define phase itself, then the first three steps in the Measure phase can be avoided.

To summarize, we carry out the following under the Measure phase:

1. To select the appropriate Y, we use the following:

a. Sigma Level (Performance of Y)
b. RTY (Rolled Throughput Yield)
c. CP(Inherent process capability), and CpK (Resultant process capability)

2. Identify the Xs and prioritize, we use the following:

a. Process mapping
b. Fish bone diagrams
c. Pareto analysis
d. FDM (Function Deployment Method)

At the end of step 2, we have the list of prioritized Xs.

Y = f(X)

An alternate way to look at Six Sigma

Y = f(X)

Here we shall talk about what this straight line function is all abouta and how it leads us to DMAIC.

Y is a function of X. Its value depends on the value assigned to X. Y, thus is dependent, while X is not. Y is called KPOV (Key Process Output Variable). X is called KPIV (Key Process Input Variable).

Y is the output. X is the input. To get results, we should focus on inputs (Xs), not on outputs (Ys). For example, commonly, companies focus on sales target, but not variables / processes that affect the sales target. When variables / processes that control the sales target are identified, and fine tuned, the sales target is automatically brought under control.

Talking in terms of software defects, if all causes of bugs are identified and addressed (all Xs ), then there is no need to test the final product! The final testing can be ignored. Though this is a an idealistic statement, this is what six sigma tries to achieve - reduce the causes of errors so that final inspection can be ignored.

Inspections, manual in particular are never error free. So, no matter how many cycles of review a code undergoes, possibility of error oversight still remains. Therefore, inspections dont really help.

Dell computers for example packages its computer components such that there is no chance of wrong fittings of parts - incompatible system elements would just not fit. Error proofing is done. (Dell call center handlers therefore are confident of letting their customers open the system and repair it as per their instructions given online...)

In software industry, this means modular programming, which yeild good benefits. Modules are pretested, self-containing entities that just need to be integrated and a final system integration test done.

Let us for example say to improve process performance, Eureka Forbes has several Ys to choose from :- Sales, Number of products sold per month, etc. Of them lets consider Sales.

Y = Sales
For this Y, following are the possible Xs
X1 = Product Quality
X2 = Product Features
X3 = Price
X4 = Advertisement Effectiveness
X5 = Sales Force Effectiveness

Of these Xs, lets pick up X5 (Sales force effectiveness) and consider this as Y. Now, for this Y, the possible Xs are:

X1 = Training Effectiveness
X2 = Recruitment and Selection Effectiveness
X3 = Attrition

Next, lets take X1 (Training Effectiveness as Y). For this, the possibel Xs are:

X1 = Trainer Competence
X2 = Duration of Training
X 3 = Training Content

Thus, Y = f (X) helps us in drilling down from output to input to help us select green belt projects. Green belt projects usually have fixed time frame. They have to be chosen such that they are completed well within the time frame. Y = f(X) helps in choosing the Xs, and the corresponding Ys that are dependent on those Xs.

The challenges faced while drilling down for Xs are:

1. Identification of Ys (Which Ys to choose)
2.

a. Measurability of Y
- Current Y
- Target Y

b. Identification of Xs

3. Identification of vital Xs among the identified Ys: Focusing on all Xs may not be yielding. There could be vital Xs whose fine tuning would give results.

4. Improve vital Xs and verify their impact on Y

5. Sustaining the improvements

The above five points are nothing but D-M-A-I-C.

1 = D
2 = M
3 = A
4 = I
5 = C

Thursday, February 08, 2007

Process performance and sigma levels...

Some processes might have to operate at levels above 6 sigma. For example mission critical applications like satellite launch, etc. So, the expected performance (and also the tolerance for defects) depends on the task on hand. Mission critical applications cannot afford to have even a single defect.

Same mean diff sigma, diff mean and same sigma...examples

Same mean different sigma

In a normal curve, most of the values tend to be crowded at the mean. Curves with the same mean and different standard deviation are as shown in the first diagram. (would upload the diagram later). Since the mean for all these curves coincides, the resultant figure looks like one curve mounting on top of the other.

The process representing curve with the steepest incline is the most capable because less values fall outside of the USL, LSL. So, the more sharper the nromal curve is, the better are the processes representing it.

Different mean, but same standard deviation

A good example of this is the heights of defense recruits in Russia, Japan, and India. Russian are the tallest, Indians the average, while the japanese are the shortest. When plotted, the curves (will upload the figure later) look like mountain ranges of same height. The curve representing the Japs will be to the extreme left, the Indians in middle, and the one represting the Russians to the extreme right.

* Note that in this example, the standard deviation in all the divisions would be the same.

Another view of six sigma

How many times of standard deviation is specification limit to the mean? If it is 2 times, then it is at 2sigma, if 3 times 3sigma, 4 times 4sigma, 5 times 5sigma.

If six standard deviations can be fitted between the mean and USL, then the process is at 6sigma. So, lesser the standard deviation, more number of them can be fit between those mean and USL thus pushing up the sigma level.

ISO Vs. Six Sigma

Will write later...

TQM Vs. Six Sigma

Will write later...

Green belt and black belt projects

Both green and black belt initiatives are process centric and driven towards process optimization. Green belt projects cover a single functional area, whereas black belt projects are cross-functional.

Green belt and black belt projects are taken up to achieve the process goals as demanded by business objectives. Identify the internal tasks where the variation can be controlled. Take them up as green belt projects…for example, the time lag between a “ready pizza” and its “pick up” can be focused and management techniques applied to optimize it.

USL/LSL & UCL/LCL

USL is the upper specification limit, while LSL is the lower specification limit. USL and LSL are dictated by / based on customer expectations. Some processes have only USL, some others have only LSL, and still others have both USL and LSL. (for example, the pizza example has only USL). Software processes have both USL and LSL.

Companies may have different kinds of processes for different customers, or may have the same processes for different customers. The types of processes to be followed are dictated by business demands, as customers have varying expectations.

UCL is the upper control limit, LCL the lower control limit. Control limits are three times the standard deviations (3Sigma always) on either side of the mean.

Pizza Delivery Example

Imagine there are two companies delivering pizzas in a city. Their average delivery times (in minutes) are seen in the table. Say, the upper specification limit is 30. That is the pizza has to be delivered within 30 minutes no matter where the client resides (within the city). (This limit is self-defined by the pizza outlets)
The Average for both the outlets is 20. But, as can be perceived by looking at the values, Outlet A seems to be more consistent, and shows less variability in cooking & delivering pizzas compared to Outlet B. Mean therefore is not a proper measure for comparing variations. A better way is thru standard deviation.

Instead of comparing process variability thru Mean, compare the sigma levels, which give a better insight into the process variability.

For Outlet B to better its process performance, it can target these: 1. Mean. 2. Standard Deviation 3. Sigma Level. Note that the specification limits cannot be changed as they are derived from customer expectations. By focusing on internal processes that are responsible for delays (such as cooking time, time lapse in dished out pizza and its pick up for delivery, etc.), Outlet B can improve on variability in delivery time.
Sigma Level = Diff bet'n mean & spec limit / Sigma


Note: In this example, the Simga Level we get is Zlt. To get Zst, add 1.5. So, as per Zst, the process of outlet A is at (7.91+1.5), and that of outlet B is (1.41+1.5).

Variability and Bell-shaped Curves

Every human activity has variability. Natural patterns of data of any process are bell-shaped curves. Most of the human processes follow a bell shaped curve. Take for example, the internet connectivity speed. Even though the connectivity speed may be 64kpbs, it is not at that speed at every point of time. It keeps on varying. At some time it may be overshoot the specified speed, and at others, remains below that. On an average, however, the connectivity is 64kbps.

Mean is the area around which most of the data points tend to cluster. Going away from the mean on either sides of the curve, values the clustering gradually come down.

Six Sigma - Green & Black Belts

Green & Black Belts: Green belts can handle most of the common situations, while black belts can address even the complex situations.

Six Sigma - Introduction

Six sigma, as is widely known, is 3.4 defects in a million products / operations / opportunities. Sigma levels can at 2, 3, 4, 5 and 6. The corresponding percentages of sigma levels, defects per million and their corresponding percentages are shown in the table.

Six Sigma has two views: one as a Measure of performance, and second as a methodology / philosophy to bring in process improvements. The first view of Six Sigma as a measure of performance is the myopic view, where current process performance is scaled to match sigma-levels (e.g. this statement - “The current process is operating at 4 sigma level”). The broader view of seeing six sigma is as a Methodology. It doesn’t mean you have to map it to sigma levels. Six Sigma methodology can be used to measure current process performance and scale up to a targeted level of “acceptable process performance” (USL/LSL). Not all companies would like to go for sigma levels of maturity (may not be aligned to business goals). Six Sigma is a philosophy that changes the way of thinking within a company. It brings in process awareness, helps in understanding problems at process levels, and inculcates process thinking at organization level.

Six Sigma is strictly a business improvement methodology. It uses the concept of normal curve (also known as Gaussian curve / Bell curve) + Shewart’s control charts + Ishikawa diagrams (fish bone diagrams) + other management and statistical tools & techniques to bring down defects.

Bill Smith is the father of Six Sigma. This term was coined by him.

Six Sigma methodology is to be applied where there is a likelihood of error occurrence (i.e., not on final inspection, but at intermediate stages before the final delivery of the product). Thru six sigma, we try to resolve problems permanently so that they never recur. This makes it possible for us to focus our time on planning futuristic projects / foreward thinking instead of being in an endless loop of working and reworking.

Usually, results of six sigma implementation are guaged by the financial gains, which are direct indicators of effectiveness of the program. However, sometimes improvement directly in terms of financial gains may not be possible to show. Alternate key performance indicators (KPI) are monitored to evaluate the effectiveness of a six sigma program.
Companies ARE NOT CERTIFIED SIX SIGMA. A company's processes are of six sigma level, not the company itself. Companies focus on critical processes and then take it upto six sigma level.

Monday, February 05, 2007

Customer Satisfaction Index

Customer satisfaction has to be driven by the solution providers - not by the client. Customer satisfaction can be better tracked thru a web-based interface so that frequent exchange of emails can be avoided. In over 90% of the cases client is non committal on the feedback. So, moot up the issue while on a call discussing on technical issues. Fill up the feedback yourself in consultation with client, and send a copy to the client; baseline the data.

Risks & Issues

Risk is something that is likely to occur and has a direct bearing on cost, schedule, or quality (or all the three) of a project. Risks can be prevented from becoming issues through proper Risk Management. Risks should be identified, categorized, prioritized, and discussed on a regular basis (team meetings).

Issue is something that's already there. It is a "risk that has occurred". Issues can only be dealt with, but cannot be prevented. Issues are limitations that we have to live with or we have to find a suitable workaround for them.

Friday, February 02, 2007

Sunset of CMMI V1.1

The SW-CMM and related products (e.g., CBA IPI and SCE) were fully retired by December 31, 2005.

SW-CMM appraisal results from CBA IPI and SCE appraisals expire on December 31, 2007.

Sunset of CMMI Version 1.1

The sunsetting period for CMMI Version 1.1 will commence when V1.2 is released. To allow the user community a reasonable amount of time to upgrade to Version 1.2, a measured approach will be used for retiring training and appraisal materials, with the sunset period ending on December 31, 2007.

Fixed Bid and T&M

Courtesy : http://weblogs.sqlteam.com

Thursday, February 01, 2007

Configuration Management

Software Configuration Management is a set of activities designed to control change by identifying the work products that are likely to change establishing the relationship among them, defining mechanisms for managing different versions of these work products, controlling changes imposed, and auditing and reporting on the changes made (Roger Pressman).

It consists of the following 4 activities:

1. Configuration Identification
2. Configuration Control
3. Configuration Status Accounting
4. Configuration Audits

Configuration Identification: Project teams (and also the SEPG, OT, OID, QAG teams) are required to identify the work products (in their respective teams) that need to be put under configuration control. Data required / used in a project can be placed under two categories: configurable and non-configurable items. Configurable items are those work products, which are likely to undergo changes and will have multiple versions at any given time during the project execution. Project plans, CM Plans, code, etc. are configurable items. On the contrary, data like emails, client chat scripts, audit reports, etc. do not change. They need not be version controlled. Such items are put under Data Management Plan.

Configuration Control: is the systematic evaluation, coordination, approval / disapproval and dissemination of proposed changes and implementation of all approved changes in the configuration of any item after formal establishment of its configuration baseline.

Change requests to process / products have to be routed through configuration control board (CCB) for approval before they can be used. Product change requests are analyzed for impact by the CCB. The mandated changes are implemented in the respective artifacts and then baselined. The CM issues a communication to the team on the baselined artifacts.

As the project advances, multiple versions of the baselined configurable items will exist. Configuration control is essential to keep the latest approved set (by CCB) of the work products floating. For code, it ensures that all developers work on the same baselined version.

Configuration Status Accounting: the recording and reporting of the configuration information is called configuration status accounting. This activity includes:

1. List of identified configurable items. (nos, and names)
2. Changes / Deviations / Waivers to configuration.
3. Implement status of approved changes. (configuration control status)
4. Version, baseline status

Configuration Audit: are necessary to verify that the integrity of work products is being maintained. Checks would be done on: baselining, configuration item identification, configuration control status, etc.

Run Charts and Control Charts

Run Charts

Run chart gives the trend of processes - its performance over a period of time; against previous performance. Run charts help in spotting aberrations in process performance and its progression over time. We can add an average line (parallel to the X axis) to the Y values to see the data deflection from average.

We can also have multiple run charts where the trends of process compliance of several projects can be compared.

Since run charts depict process trends, significant trends or patterns can be identified and investigated for the root causes. Similarly, special variations (significant deviant data points) can be spotted and their causes identified & addressed.

The above chart does not tell anything about the tolerance limits of PCI (that the organization would put up with). It merely tells us about the PCI trend for the months stated. So, without a guiding process performance limits, it is not of much use.

DSPM, Data Security Posture Management, Data Observability

DATA SECURITY POSTURE MANAGEMENT DSPM, or Data Security Posture Management, is a practice that involves assessing and managing the security ...