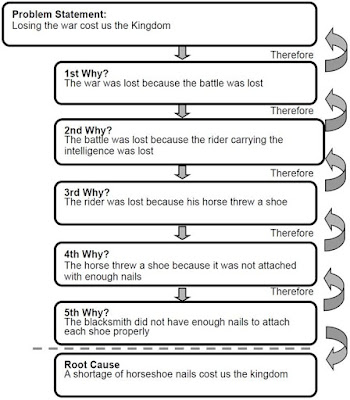
RCA comprises the techniques and tools to uncover the underlying causes of problems.
- Most common is 5-Whys?
- When you have a vast amount of data:
- Do a 80-20 Pareto chart to identify the 20% causing the defects.
- Do a 5-Why on the 20% based on the defect categories.
- Fish Bone / Ishikawa Diagrams
* Images may be subjected to copyrights. I don't hold the rights.


No comments:
Post a Comment